
Search for Indicators
All Data
For more comparison information and indicator description, you can click on the indicator labels below. Additionally, you can download indicator information by scrolling to the bottom of the page and click on the 'Export in CSV format' link for a full indicator descriptions and source links.
Indicator Gauge Icon Legend
Legend Colors
Red is bad, green is good, blue is not statistically different/neutral.
Compared to Distribution
 the value is in the best half of communities.
 the value is in the 2nd worst quarter of communities.
 the value is in the worst quarter of communities.
Compared to Target
 meets target;
  does not meet target.
Compared to a Single Value
 lower than the comparison value;
 higher than the comparison value;
 not statistically different from comparison value.
Trend

 non-significant change over time;
 significant change over time;
  no change over time.
Compared to Prior Value
 higher than the previous measurement period;
 lower than the previous measurement period;
 no statistically different change from previous measurement period.
State: Ohio
Economy / Poverty
Value
Compared to:
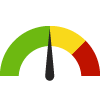
State: Ohio Veterans Living Below Poverty Level
State: Ohio Veterans Living Below Poverty Level
7.2%
(2018-2022)
Compared to:


U.S. States
The distribution is based on data from 50 U.S. states and the District of Columbia.
US Value
(7.0%)
The regional value is compared to the national value.
Trend
This comparison measures the indicator’s values over multiple time periods.<br>The Mann-Kendall Test for Statistical Significance is used to evaluate the trend<br>over 4 to 10 periods of measure, subject to data availability and comparability.
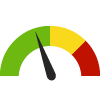
State: Ohio Young Children Living Below Poverty Level
State: Ohio Young Children Living Below Poverty Level
20.7%
(2018-2022)
Compared to:

U.S. States
The distribution is based on data from 50 U.S. states and the District of Columbia.
US Value
(18.1%)
The regional value is compared to the national value.
Trend
This comparison measures the indicator’s values over multiple time periods.<br>The Mann-Kendall Test for Statistical Significance is used to evaluate the trend<br>over 4 to 10 periods of measure, subject to data availability and comparability.
State: Ohio Youth not in School or Working
State: Ohio Youth not in School or Working
1.9%
(2018-2022)
Compared to:
U.S. States
The distribution is based on data from 50 U.S. states and the District of Columbia.
US Value
(1.8%)
The regional value is compared to the national value.
Trend
This comparison measures the indicator’s values over multiple time periods.<br>The Mann-Kendall Test for Statistical Significance is used to evaluate the trend<br>over 4 to 10 periods of measure, subject to data availability and comparability.
State: Ohio
Education
Value
Compared to:
State: Ohio Chronic Absenteeism for Students with Medicaid
State: Ohio Chronic Absenteeism for Students with Medicaid
38.6%
Percent %
(2022-2023 School Year)
Compared to:
Prior Value
(43.7%)
Prior Value compares a measured value with the previously measured value. Confidence intervals were not taken into account in determining the direction of the comparison.
State: Ohio
Education / Childcare & Early Childhood Education
Value
Compared to:
State: Ohio Child Care Centers
State: Ohio Child Care Centers
8.0
Per 1,000 population under age 5
(2022)
Compared to:
US Value
(7.0)
The regional value is compared to the national value.
Prior Value
(7.4)
Prior Value compares a measured value with the previously measured value. Confidence intervals were not taken into account in determining the direction of the comparison.
State: Ohio
Education / Educational Attainment
Value
Compared to:
State: Ohio People 25+ with a Bachelor's Degree or Higher
State: Ohio People 25+ with a Bachelor's Degree or Higher
30.4%
(2018-2022)
Compared to:


U.S. States
The distribution is based on data from 50 U.S. states and the District of Columbia.
US Value
(34.3%)
The regional value is compared to the national value.
Trend
This comparison measures the indicator’s values over multiple time periods.<br>The Mann-Kendall Test for Statistical Significance is used to evaluate the trend<br>over 4 to 10 periods of measure, subject to data availability and comparability.
State: Ohio People 25+ with a High School Diploma or Higher
State: Ohio People 25+ with a High School Diploma or Higher
91.4%
(2018-2022)
Compared to:
U.S. States
The distribution is based on data from 50 U.S. states and the District of Columbia.
US Value
(89.1%)
The regional value is compared to the national value.
Trend
This comparison measures the indicator’s values over multiple time periods.<br>The Mann-Kendall Test for Statistical Significance is used to evaluate the trend<br>over 4 to 10 periods of measure, subject to data availability and comparability.
State: Ohio Veterans with a High School Diploma or Higher
State: Ohio Veterans with a High School Diploma or Higher
94.0%
(2018-2022)
Compared to:
U.S. States
The distribution is based on data from 50 U.S. states and the District of Columbia.
US Value
(95.0%)
The regional value is compared to the national value.
Trend
This comparison measures the indicator’s values over multiple time periods.<br>The Mann-Kendall Test for Statistical Significance is used to evaluate the trend<br>over 4 to 10 periods of measure, subject to data availability and comparability.
State: Ohio
Education / School Environment
Value
Compared to:
State: Ohio Student-to-Teacher Ratio
State: Ohio Student-to-Teacher Ratio
16.4
Students per teacher
(2022-2023)
Compared to:
U.S. States
The distribution is based on data from 50 U.S. states and the District of Columbia.
US Value
(15.4)
The regional value is compared to the national value.
Prior Value
(16.9)
Prior Value compares a measured value with the previously measured value. Confidence intervals were not taken into account in determining the direction of the comparison.
Trend
This comparison measures the indicator’s values over multiple time periods.<br>The Mann-Kendall Test for Statistical Significance is used to evaluate the trend<br>over 4 to 10 periods of measure, subject to data availability and comparability.
State: Ohio
Education / Student Performance K-12
Value
Compared to:
58.9%
(2022-2023)
Compared to:


Prior Value
(62.5%)
Prior Value compares a measured value with the previously measured value. Confidence intervals were not taken into account in determining the direction of the comparison.
Trend
This comparison measures the indicator’s values over multiple time periods.<br>The Mann-Kendall Test for Statistical Significance is used to evaluate the trend<br>over 4 to 10 periods of measure, subject to data availability and comparability.
State: Ohio 4th Grade Students Proficient in Math
State: Ohio 4th Grade Students Proficient in Math
66.8%
(2022-2023)
Compared to:
Prior Value
(63.6%)
Prior Value compares a measured value with the previously measured value. Confidence intervals were not taken into account in determining the direction of the comparison.
Trend
This comparison measures the indicator’s values over multiple time periods.<br>The Mann-Kendall Test for Statistical Significance is used to evaluate the trend<br>over 4 to 10 periods of measure, subject to data availability and comparability.
57.5%
(2022-2023)
Compared to:
Prior Value
(52.7%)
Prior Value compares a measured value with the previously measured value. Confidence intervals were not taken into account in determining the direction of the comparison.
Trend
This comparison measures the indicator’s values over multiple time periods.<br>The Mann-Kendall Test for Statistical Significance is used to evaluate the trend<br>over 4 to 10 periods of measure, subject to data availability and comparability.
State: Ohio 8th Grade Students Proficient in Math
State: Ohio 8th Grade Students Proficient in Math
46.4%
(2022-2023)
Compared to:
Prior Value
(43.0%)
Prior Value compares a measured value with the previously measured value. Confidence intervals were not taken into account in determining the direction of the comparison.
Trend
This comparison measures the indicator’s values over multiple time periods.<br>The Mann-Kendall Test for Statistical Significance is used to evaluate the trend<br>over 4 to 10 periods of measure, subject to data availability and comparability.
State: Ohio High School Graduation
State: Ohio High School Graduation
91.6%
(2021-2022)
Compared to:
US Value
(86.5% in 2020)
The regional value is compared to the national value. The source for the national value is National Center for Education Statistics
Prior Value
(91.4%)
Prior Value compares a measured value with the previously measured value. Confidence intervals were not taken into account in determining the direction of the comparison.
Trend
This comparison measures the indicator’s values over multiple time periods.<br>The Mann-Kendall Test for Statistical Significance is used to evaluate the trend<br>over 4 to 10 periods of measure, subject to data availability and comparability.
HP 2030 Target
(90.7%)
State: Ohio
Environmental Health / Air
Value
Compared to:
State: Ohio Air Pollution due to Particulate Matter
State: Ohio Air Pollution due to Particulate Matter
8.9
Micrograms per cubic meter
(2019)
Compared to:
U.S. States
The distribution is based on data from 50 U.S. states and the District of Columbia.
US Value
(7.4)
The regional value is compared to the national value.
Prior Value
(9.0)
Prior Value compares a measured value with the previously measured value. Confidence intervals were not taken into account in determining the direction of the comparison.
Trend
This comparison measures the indicator’s values over multiple time periods.<br>The Mann-Kendall Test for Statistical Significance is used to evaluate the trend<br>over 4 to 10 periods of measure, subject to data availability and comparability.
State: Ohio Recognized Carcinogens Released into Air
State: Ohio Recognized Carcinogens Released into Air
2,179,554
Pounds
(2022)
Compared to:

Prior Value
(2,156,616)
Prior Value compares a measured value with the previously measured value. Confidence intervals were not taken into account in determining the direction of the comparison.
Trend
This comparison measures the indicator’s values over multiple time periods.<br>The Mann-Kendall Test for Statistical Significance is used to evaluate the trend<br>over 4 to 10 periods of measure, subject to data availability and comparability.
State: Ohio
Environmental Health / Built Environment
Value
Compared to:
State: Ohio Access to Exercise Opportunities
State: Ohio Access to Exercise Opportunities
83.9%
(2024)
Compared to:
U.S. States
The distribution is based on data from 50 U.S. states and the District of Columbia.
US Value
(84.1%)
The regional value is compared to the national value.
Prior Value
(83.8%)
Prior Value compares a measured value with the previously measured value. Confidence intervals were not taken into account in determining the direction of the comparison.
State: Ohio Access to Parks
State: Ohio Access to Parks
59.6%
(2020)
Compared to:
U.S. States
The distribution is based on data from 50 U.S. states and the District of Columbia.
Prior Value
(38.0%)
Prior Value compares a measured value with the previously measured value. Confidence intervals were not taken into account in determining the direction of the comparison.
State: Ohio Food Environment Index
State: Ohio Food Environment Index
7.0
(2024)
Compared to:
U.S. States
The distribution is based on data from 50 U.S. states and the District of Columbia.
US Value
(7.7)
The regional value is compared to the national value.
Prior Value
(6.8)
Prior Value compares a measured value with the previously measured value. Confidence intervals were not taken into account in determining the direction of the comparison.
Trend
This comparison measures the indicator’s values over multiple time periods.<br>The Mann-Kendall Test for Statistical Significance is used to evaluate the trend<br>over 4 to 10 periods of measure, subject to data availability and comparability.
State: Ohio Liquor Store Density
State: Ohio Liquor Store Density
5.6
Stores per 100,000 population
(2021)
Compared to:

U.S. States
The distribution is based on data from 50 U.S. states and the District of Columbia.
US Value
(10.7)
The regional value is compared to the national value.
Prior Value
(5.7)
Prior Value compares a measured value with the previously measured value. Confidence intervals were not taken into account in determining the direction of the comparison.
Trend
This comparison measures the indicator’s values over multiple time periods.<br>The Mann-Kendall Test for Statistical Significance is used to evaluate the trend<br>over 4 to 10 periods of measure, subject to data availability and comparability.
State: Ohio Proximity to Highways
State: Ohio Proximity to Highways
7.2%
(2020)
Compared to:
U.S. States
The distribution is based on data from 50 U.S. states and the District of Columbia.
Prior Value
(6.9%)
Prior Value compares a measured value with the previously measured value. Confidence intervals were not taken into account in determining the direction of the comparison.
State: Ohio
Environmental Health / Toxins & Contaminants
Value
Compared to:
0.5%
(2022)
Compared to:
Prior Value
(0.6%)
Prior Value compares a measured value with the previously measured value. Confidence intervals were not taken into account in determining the direction of the comparison.
Trend
This comparison measures the indicator’s values over multiple time periods.<br>The Mann-Kendall Test for Statistical Significance is used to evaluate the trend<br>over 4 to 10 periods of measure, subject to data availability and comparability.
1.9%
(2022)
Compared to:
Prior Value
(2.0%)
Prior Value compares a measured value with the previously measured value. Confidence intervals were not taken into account in determining the direction of the comparison.
Trend
This comparison measures the indicator’s values over multiple time periods.<br>The Mann-Kendall Test for Statistical Significance is used to evaluate the trend<br>over 4 to 10 periods of measure, subject to data availability and comparability.
State: Ohio Houses Built Prior to 1950
State: Ohio Houses Built Prior to 1950
25.1%
(2018-2022)
Compared to:
U.S. States
The distribution is based on data from 50 U.S. states and the District of Columbia.
US Value
(16.7%)
The regional value is compared to the national value.
Trend
This comparison measures the indicator’s values over multiple time periods.<br>The Mann-Kendall Test for Statistical Significance is used to evaluate the trend<br>over 4 to 10 periods of measure, subject to data availability and comparability.
State: Ohio PBT Released
State: Ohio PBT Released
1,034,908
Pounds
(2022)
Compared to:
Prior Value
(1,060,574)
Prior Value compares a measured value with the previously measured value. Confidence intervals were not taken into account in determining the direction of the comparison.
Trend
This comparison measures the indicator’s values over multiple time periods.<br>The Mann-Kendall Test for Statistical Significance is used to evaluate the trend<br>over 4 to 10 periods of measure, subject to data availability and comparability.
